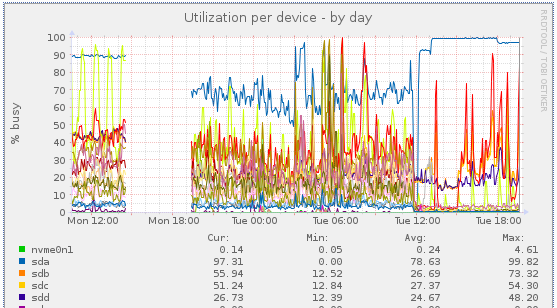
Some days ago I blogged about my issue with one of the disks in my server having a high utilization and latency. There have been several ideas and guesses what the reason might be, but I think I found the root cause today:
SMART Self-test log structure revision number 1
Num Test_Description Status Remaining LifeTime(hours) LBA_of_first_error
# 1 Extended offline Completed: read failure 90% 50113 60067424
# 2 Short offline Completed without error 00% 3346
After the RAID-Sync-Sunday last weekend I removed sda from my RAIDs today and started a “smartctl -t long /dev/sda“. This test was quickly aborted because it already ran into an read error after just a few minutes. Currently I’m still running a “badblocks -w” test and this is the result so far:
# badblocks -s -c 65536 -w /dev/sda
Testing with pattern 0xaa: done
Reading and comparing: 42731372done, 4:57:27 elapsed. (0/0/0 errors)
42731373done, 4:57:30 elapsed. (1/0/0 errors)
42731374done, 4:57:33 elapsed. (2/0/0 errors)
42731375done, 4:57:36 elapsed. (3/0/0 errors)
46.82% done, 6:44:41 elapsed. (4/0/0 errors)
Long story short: I already ordered a replacement disk!
But what’s also interesting is this:

I removed the disk today at approx. 12:00 and you can see the immediate effect on the other disks/LVs (the high blue graph from sda shows the badblocks test), although the RAID10 is now in degraded mode. Interesting what effect (currently) 4 defect blocks can have to a RAID10 performance without smartctl taking notice of this. Smartctl only reported an issue after issueing the selftest. It’s also strange that the latency and high utilization slowly increased over time, like 6 months or so.